Gold knocks on a door that's been shut for 50 years as bitcoin tests a defining support
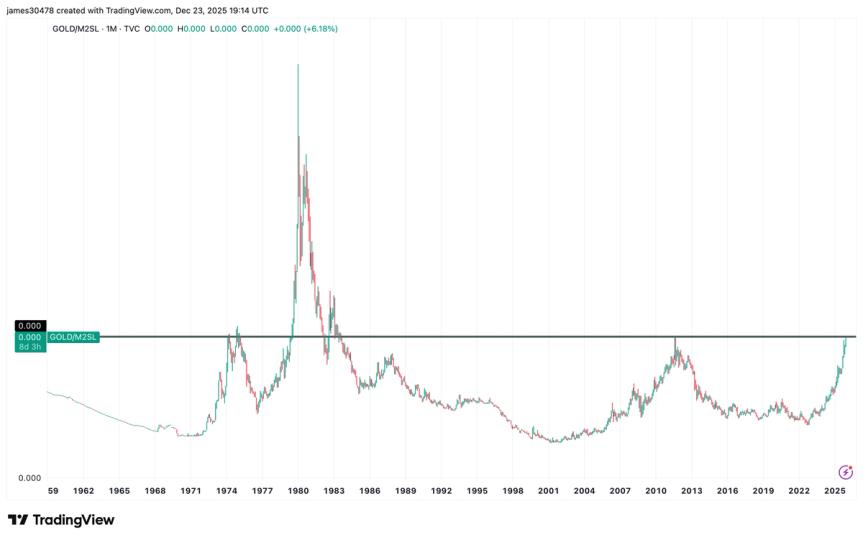
Gold knocks on a door that's been shut for 50 years as bitcoin tests a defining support Measured against U.S. money supply, gold is back at levels that marked major historical peaks, while bitcoin retraces toward a key cycle floor. What to know: Gold is challenging a resistance zone against the U.S. money supply that was last seen in 2011 and the early 1970s, and only broken decisively during the late 1970s surge. Against the same measure, bitcoin, known to some as digital gold, is testing support near the April "tariff tantrum" low that also marks prior cycle high from March 2024. Gold is at a critical juncture when measured against U.S. money supply (M2SL), testing a level it last reached in 2011 and not surpassed since the 1970s, when the price more than tripled to a then-record $700 an ounce over the course of several years. Gold vs US Money Supply (TradingView) BTCUSD/M2 Money Supply (TradingView) In contrast, bitcoin , referred to by some supporters as digital gold, has dropped toward a support level, revisiting lows it last touched during the "tariff tantrum" in April. See all newsletters Back in 2011, gold cost $1,800 an ounce. It's now around $4,500. When plotted against the money supply, which represents the total stock of dollars circulating in the U.S. economy, including cash, bank deposits and liquid savings, the price has reached a level that's historically acted as a major resistance zone. To get there, the precious metal has surged 70% this year. This sharply contrasts with bitcoin, which is down roughly 10%. Still, bitcoin continues to make fresh highs relative to the U.S. money supply each cycle, and the current support level also marks the prior cycle high in March 2024. More For You State of the Blockchain 2025 L1 tokens broadly underperformed in 2025 despite a backdrop of regulatory and institutional wins. Explore the key trends defining ten major blockchains below. What to know: 2025 was defined by a stark divergence: structural progress collided with stagnant price action. Institutional milestones were reached and TVL increased across most major ecosystems, yet the majority of large-cap Layer-1 tokens finished the year with negative or flat returns. This report analyzes the structural decoupling between network usage and token performance. We examine 10 major blockchain ecosystems, exploring protocol versus application revenues, key ecosystem narratives, mechanics driving institutional adoption, and the trends to watch as we head into 2026. More For You Bitcoin nears breakout from the $85,000-$90,000 range as options expiry looms A year-end options expiry for bitcoin is suppressing volatility just as macro and risk-asset positioning turns supportive for a higher price. What to know: Bitcoin has spent the majority of December pinned between $85,000 and $90,000. That range has been enforced by dealer hedging tied to heavy options exposure, with dips bought near $85,000 and rallies sold near $90,000. Some $27 billion of open interest are set to expire on Deribit with a strong call bias, and options mechanics point to a...
Preview: ~500 words
Continue reading at Coindesk
Read Full Article